How to Calculate Standard Deviation In Excel
By gobrain
Jun 14th, 2024
Standard deviation is a statistical measure that tells you how spread out a set of data is from its average value (the mean). In simpler terms, it tells you how much variation there is in your data.
On the other hand, Excel is a software for data analysis, so, it is important to know how to calculate standard deviation in excel. Let's begin
What is The Formula Of Standard Deviation
Before showing how to calculate the standard deviation in Excel, let's see the formula for calculating it. The formula for standard deviation of a dataset is
SD = √(Σ(x - μ)^2 / n)
Where;
- x is a data in set,
- μ is the mean,
- n is the number of values in set,
- Σ is the sum of
The formula above is used to calculate standard deviation of entire population, however as it can be difficult to obtain data for the entire population, a sample is selected and the standard deviation is calculated, which requires a small change in the formula, as shown below:
SD = √(Σ(x - μ)^2 / (n-1))
How To Calculate Standard Deviation in Excel
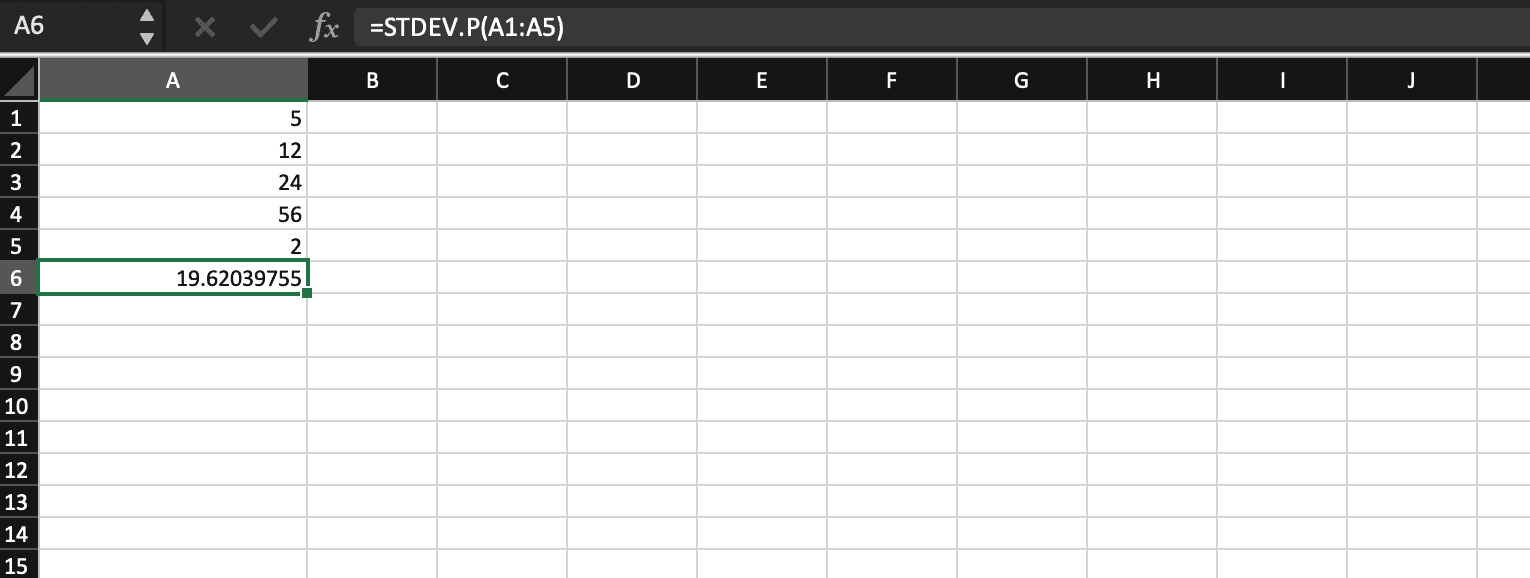
In Excel, you can use the STDEV.P(range) function to find the population standard deviation of a data set.
Range represents the group of values for which you want to determine the standard deviation. For example, if your data is located in the range A1:A10, the formula to calculate the standard deviation will be:
=STDEV.P(A1:A10)
If you want to calculate standard deviation for a sample, the formula will be:
=STDEV.S(range)
Conclusion
In this brief guide, we have showed the formula of Standard deviation of a dataset and how to calculate it in Excel with the help of STDEV function.
Thank you for reading.